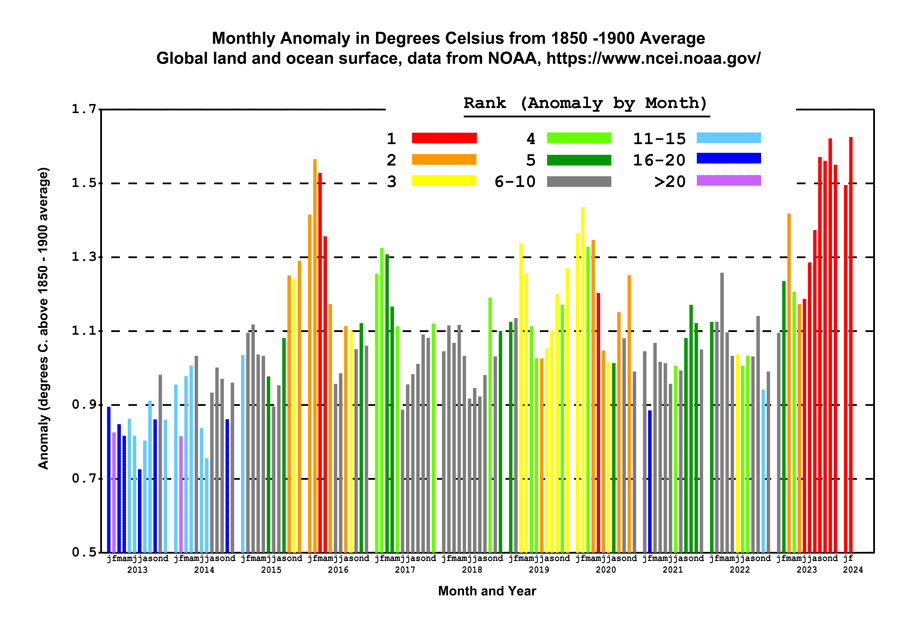
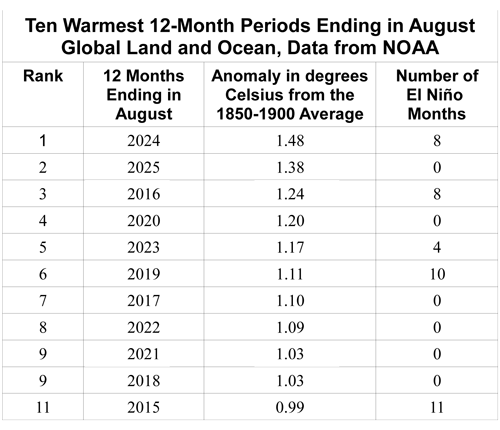
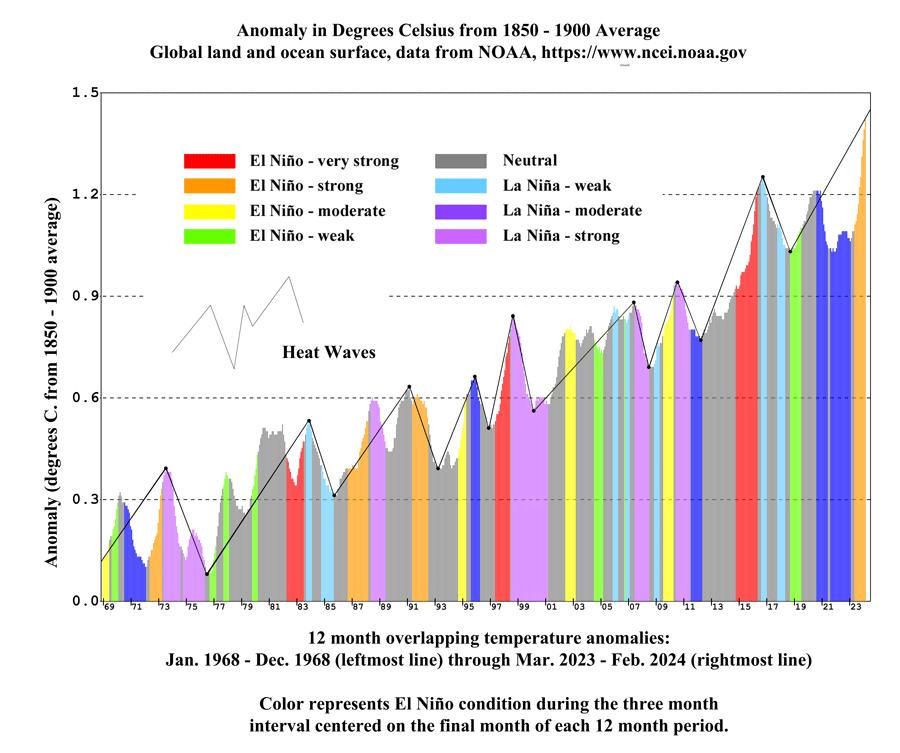
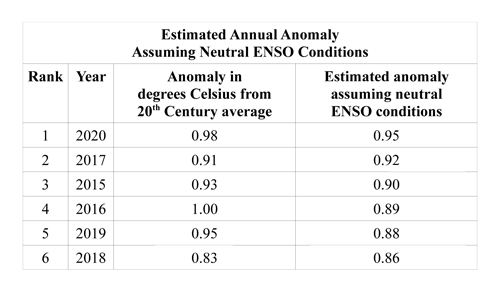
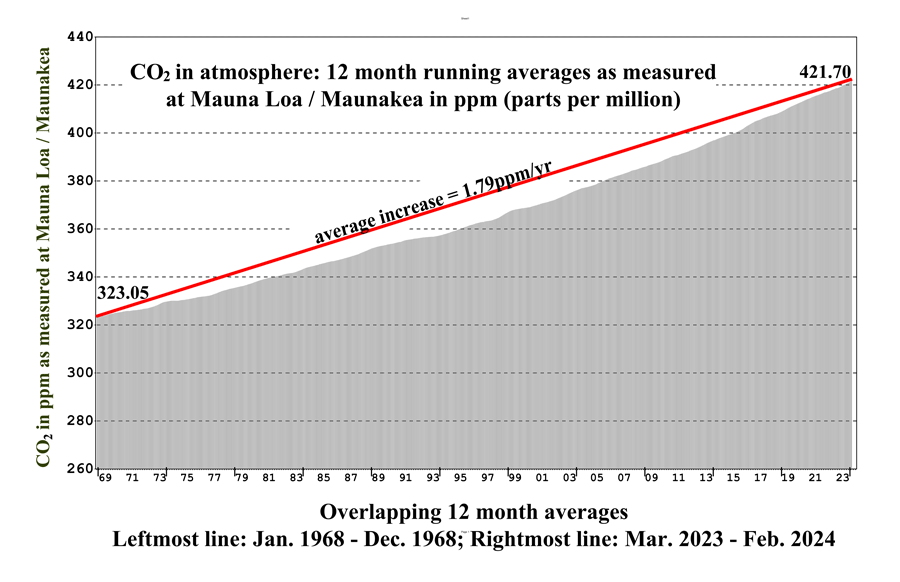
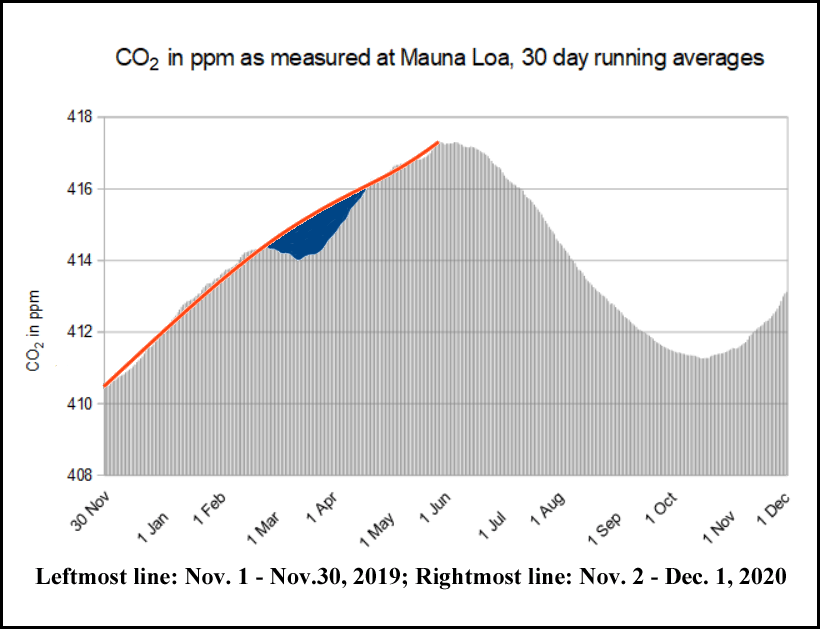
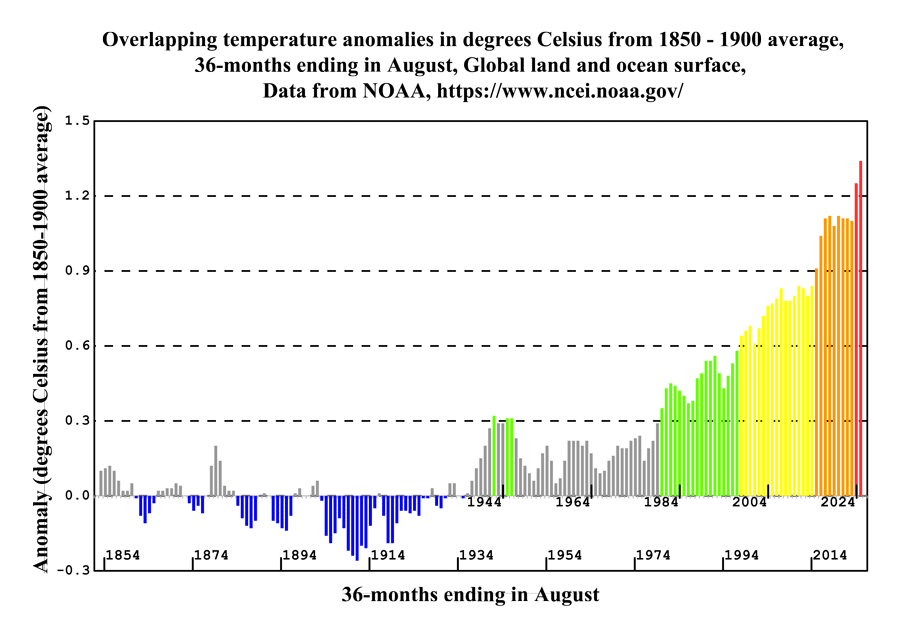
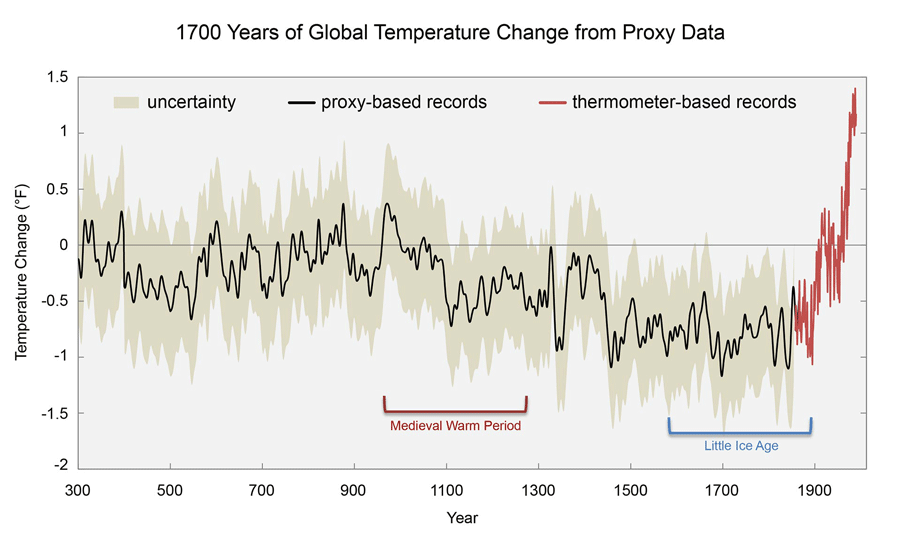
 A few important highlights from past months  (December 2024 through February 2025) 1. The average temperature anomaly for meteorological winter 2024-25 was 1.47°C above the 1850-1900 average, second only to meteorological winter 2023-24 whose anomaly was 1.55°C. January 2025 was the warmest January on record, 1.52°C above the 1850-1900 average. February 2025 was the third warmest February on record and was the first month since May 2023 to not be among the two warmest months with that same name. While La Niña conditions appear to be bringing surface temperatures down somewhat, surface temperatures are still abnormally high. 2. The last eleven 12-month periods ending in February (2015-2025) were the 11 warmest on record. The two most recent such 12-month periods were by far the two warmest, with anomalies of 1.43°C and 1.41°C. The anomaly for the third warmest such period ending in February 2020 was 1.19°C. Some other models are showing significantly higher anomalies than NOAA's model. Copernicus Climate Change Service (CCCS) computes the anomaly for the 12-month period ending in February 2025 as 1.59°C above the 1850-1900 average, as opposed to NOAA's 1.43°C. Lately, “experts” appear to be talking about warming of 2.0°C over pre-industrial estimates, rather than 1.5°C. 3. The average concentration of carbon dioxide in the atmosphere during meteorological winter 2024-25 was 426.36ppm, an increase of 3.32ppm over meteorological winter 2023-24, as measured at Mauna Loa. The 12 month running average for March 2024 through Feb, 2025 was 425.12ppm, an increase of 3.43ppm over the 12-month running average for March 2023 through Feb, 2024, but below the record 3.57ppm set in January 2025 for increases in the 12-month running average over two consecutive non-overlapping 12-month periods. Hmmm, weren't the 2015 Paris Climate Accords supposed to bring down CO2 in the atmosphere? What happened? 4. The El Niño / La Niña (ONI) index fell to −0.6 over the December through February, 3-month period, within the weak La Niña range. La Niña conditions are expected to peter out before qualifying as a full-blown La Niña episode. La Niña conditions may finally be bringing surface temperatures down slightly. WAR 5. Ecologically, Gaza has been totally obliterated by the Israeli genocidal war machine. Gaza is now a pile of toxic rubble with 80% of its carbon-sequestering trees destroyed. FIRE 6. The Los Angeles area has been devastated by multiple fires, driven by high winds approaching 100mph, high temperatures, low humidity, lack of rainfall, dry vegetation and insufficient water resources. Early estimates: at least 29 dead, thousands of buildings incinerated, hundreds of thousands of residents forced to evacuate, and an estimated $250 billion in damages. The death toll could end up in the thousands if you count deaths from breathing toxic smoke from burning buildings or drinking contmainated water from melted pipes. While multi-million-dollar mansions in Pacific Palisades burned to the ground, over 75,000 unhoused called the streets and parks of Los Angeles County home. “Vengeance is mine, I will repay, saith the Lord.” 7. February wildfires in southern Argentina devastate the Patagonia region. STORMS AND FLOODING 8. Cyclone Chido caused devastating flooding in the French colony of Mayotte which lies between Madagascar and the African mainland. Like most European colonies, Mayotte's well-being has long been ignored by the colonizing entity. 9. Floods in Haiti, the Western Hemisphere's poorest country, have killed at least 13 and affected thousands. 10. In January 2025, an intensification of the polar vortex caused unprecedented snow and cold on the northern coast of the GULF OF MEXICO. Pensacola received 8.9 inches of snow trouncing the record of 3 inches set in 1895. Temperatures dropped to 2 F at New Iberia, LA, beating the previous record of 17 F set in 2018. 11. The weather disturbance that struck the northern coast of the GULF OF MEXICO in January, crossed the Atlantic and hit Ireland, Scotland and Norway as Storm owyn with a low pressure of 939 mbar and 135 mph winds. Storm Eowyn caused two fatalities and left over one million without power. Eowyn was Europe's fifth most intense windstorm on record. 12. Mid-February floods kill at least 15 in Kentucky. 13. Floods in Peru from heavy rains have killed 46 and injured thousands. MELTING ICE 14. Mid-February 2025 saw the lowest combined Arctic and Antarctic sea-ice extent on record, at 15.76 million km2 15. The world's glaciers lost an estimates 273 billion tonnes of ice annually during the 21st Century. The rate of loss is increasing. The world's glaciers have lost an estimated 5% of their mass. HEAT 16. The southernmost state of Brazil, Rio Grande do Sul, which experienced intense flooding last May, is now in the midst of a heat wave that has forced schools to close. The city of Quara experienced wet-bulb temperatures of 50°C. ENERGY GENERATION 17. Renewable energy is under attack in the United States as the Trump administration appears to be ending government subsidies for renewable energy and prioritizing fossil-fuel development. 18. In spite of China's unprecedented roll-out of renewable energy in 2024, China has also increased its reliance on coal, as construction of coal-fired electricity generation reached a ten-year high in 2024. Perhaps we need to focus on reducing our overall need for energy as well as providing energy from nonpolluting renewable sources. 19. According to a recent study by Howarth, Liquified Natural Gas (LNG) is 33% more damaging to the environment than coal when considering transportation and production as well as electricity generation. Nevertheless, the US and allies blew up the Nord Stream pipeline in 2022 to facilitate the sale of US produced LNG to Europe. Now, the Trump administration threatens other countries with tariffs if they don't buy US produced LNG. GEOENGINEERING 20. Yet another attempt to geoengineer planet Earth has ended in failure. The Arctic Ice Project which sought to place toxic reflective material over ice covered lakes in Alaska has been discontinued. Panganga Pungowiyi of the Indigenous Environmental Network remarked, “Nature is not a laboratory; it is a living entity we are in relationship with.” CARBON SOURCES 21. While methane leaks from the arctic seabed are well-known, for the first time, massive methane leaks from the antarctic seabed have also been discovered. 22. The world's peatlands contain more carbon than the world's forests; yet, peatlands are largely unprotected and their destruction adds massive amounts of carbon to our overburdened atmosphere. OIL SPILLS 23. Peru declared a 90-day environmental emergency due to an oil spill on its northern coast, which occurred while attempting to load a tanker. EARTHQUAKES 24. The Chinese province of Tibet was shaken by a magnitude 6.8 earthquake, killing at least 95. To what extent melting glaciers have destabilized the fault line and contributed to the earthquake is uncertain. ELECTRIC VEHICLES 25. Global sales of electric vehicles increased by 18% in January reaching 1.3 million. PARIS CLIMATE ACCORDS 26. The Paris Climate Accords appear to be dead. The United States has withdrawn for a second time. 95% of countries have missed the deadline for submitting 2035 climate pledges.  (September through November 2024)  1. The months September through November 2024 were somewhat less anomalously warm than the corresponding three months in 2023 but far warmer than all other months of the same name. Surface temperatures are still extremely high with October and November temperatures more than 1.5°C above the 1850-1900 average. 2. The last ten 12-month periods ending in November (2015-2024) were the ten warmest on record. 3. The average concentration of carbon dioxide in the atmosphere during meteorological autumn 2024 was 422.75 ppm as measured at Mauna Loa, an increase of 3.49 ppm over meteorological autumn 2023. 4. The El Niño / La Niña (ONI) index over meteorological autumn was −0.2 well within the neutral range. So far the predicted La Niña episode that was supposed to cool surface temperatures off has not materialized. STORMS AND FLOODING 5. A rare category 5 equivalent Typhoon Yagi struck the Philippines, South China and Vietnam in early September killing at least 800 (mostly in Vietnam) and doing over $12 billion in damages (mostly in China). Yagi, which means goat in Japanese, is one of only four category V equivalent typhoons ever recorded in the South China Sea. 6. Hurricane Helene came ashore as a category IV hurricane in Florida's big bend area. It moved north and wreaked havoc, flooding a totally unprepared North Carolina, killing over 200 people and doing over $100 billion of damages. Floods from Helene stirred up toxins which will continue to damage both people and the environment for many years to come. 7. Hurricane Milton, which closely followed Helene, reached category V intensity. Weakening to category III by time of landfall, south of Tampa, Milton cut a swath of destruction across central Florida killing 35 and causing an estimated $85 billion in damages. 8. After killing 125 in the Philippines, Storm Trami dropped almost a foot of water on China's Hainan Island in 24 hours flooding much of the Island, before going on to make landfall in Vietnam. 9. Sea levels in China's Bohai Sea inexplicable rose over 5 feet in hours flooding the streets of Tianjin. Scientists are trying to figure out why. 10. Meanwhile in Eastern Europe, heavy rains from Storm Boris flooded Poland, the Czech Republic and much of east and central Europe, killing at least 26. Poland's prime minister, Donald Tusk, blamed the flooding on beavers. (Actually by damming streams and rivers, beavers help retain water, sequestering carbon, slowing down river flows and adding resilience to wetland systems.) 11. Catastrophic flooding in and around Valencia has killed over 150 in one of Spain's worst disasters on record. 12. Tropical storm Sara causes over 10 fatalities in Central America and the Caribbean while displacing thousands. 13. After the ongoing Israeli genocide had destroyed most infrastructure in Gaza, Gazans, living in tents, have to cope with flooding made worse by climate change caused mostly by wealthy countries. 14. Catastrophic rainfall and flooding persisted through the Fall in much of Africa. Africa has suffered thousands of fatalities in 2024 from extreme weather which has impacted millions. A dam in Northern Nigeria collapsed, flooding the town of Maiduguri and washing crocodiles and snakes from a local zoo into flooded communities. 2024 was less an aberration in Africa and more a continuation of a pattern of increased rainfall over the past 5 years. DROUGHT 15. October 2024 tied for the second driest month on record in the lower 48 US states, logging an average 0.95 inches of rain. New York and Philadelphia experienced their driest month ever. DISEASE 16. A study of valley fever in California showed that cases tended to spike as heavy rains came after prolonged drought. Cases of valley fever which can cause respiratory illness and joint pain and, in some cases spread throughout the body and be fatal, have increased. With changes to the climate and frequent prolonged droughts, valley fever has extended its range. While drought appears to decrease valley fever cases in the short term, the net effect seems to be an increase over time. 17. In locations, where white-nose syndrome has devastated the bat population, infant mortality has risen. The connection is complex. Fungal disease killed bats, bats stopped eating enough insects, farmers applied more pesticide, more babies died. Biodiversity is important to human health. CAPITALISM 18. Global Witness has released a study showing that at least 196 defenders of the Earth were murdered in 2023. Colombia leads the pack with 79 murders. At least 25 environmental defenders were murdered in 2023 after opposing mining operations. 19. This year's COP29 was yet another failure, variously described as a dumpster fire with planet Earth burning and a soulless triumph for the rich. COP29 was likely attended by more lobbyists than people. Poor countries reeling from climate change were offered a paltry $300 billion, mostly in loans from rich countries. This is disgusting. Poor countries must take out loans in order to try to adapt to climate change from the same wealthy countries that are responsible for climate change in the first place. 20. Two heavily-loaded Russian oil tankers sank in violent seas in the Kirch Straight between the Black Sea and the Sea of Azov, likely causing severe environmental damage. This might have been avoided if Russia had not been so busy fighting a war in The Ukraine. WILDFIRES 21. September wildfires in Bolivia burned almost 25 million acres releasing more than 100 million tonnes of carbon dioxide and degrading air quality over much of central South America.  (June through August 2024)  1. August 2024 makes 15 months in a row, each one warmer than all previous months with that same name. Eight of the 15 were over 1.5°C above the 1850-1900 average. 2. With the close of the 2023-24 El Niño episode, surface temperatures are not quite so anomalously warm as a few months ago, but still extremely high. The average anomaly over meteorological Summer registered 1.35°C above the 1850-1900 average. Ocean temperatures as well as land temperatures have fallen slightly from previous highs. 3. The last ten 12-month periods ending in August (2015-2024) were the ten warmest on record. 4. The 12-month period ending in August 2024 was the warmest 12-month period on record, 1.50°C above the 1850-1900 average, beating out the previous two 12-month period by an insignificant fraction of one hundredth of a degree. 5. The average concentration of carbon dioxide in the atmosphere during meteorological summer 2024 was 425.13 ppm as measured at Mauna Loa, an increase of 3.42 ppm over meteorological summer 2023. 6. The El Niño / La Niña (ONI) index over the June through August 3-month period was 0.1, down from a high of 2.0 during the November 2023 through January 2024 3-month period. Summer marked the end of the 2023-24 El Niño episode. While strong, the 2023-24 El Niño episode was well below the strength of the 2014-2016 El Niño. Climate models are still predicting a transition to La Niña conditions later in 2024, although not so strongly as in previous predictions. La Niña conditions favor an intense North Atlantic hurricane season. FORESTS 7. A ground-breaking study by the US Forest Service found that in spite of wildfires, insects, drought, logging and other stressors, the world's forests have mostly maintained their ability to sequester carbon over the past 30 years. The study recommends less deforestation, more reforestation. 8. 1/2 million trees have been sacrificed for Tesla's gigafactory in Germany. 9.California's iconic Joshua trees (actually yuccas) are under stress from increased heat and drought. DEFENDING AGAINST CLIMATE INVADERS 10. Afghanistan is among the countries most vulnerable to climate change and also among the countries least responsible for climate change. Lacking international support, Afghanistan adapts to climate change as best it can. Lutfullah Khairkhwa, the Taliban s deputy higher education minister remarked, Just like they invaded our country, they ve invaded our climate. We must defend our climate, our water, our soil to the same extent we defend ourselves against invasions. Maybe, if other countries were also ready to defend their climate against invaders, we could reverse climate change. HUNGER AND THIRST 11. Almost 10% of the world's population went hungry last year. Climate change was a major factor. 12. Wildfires are contaminating our drinking water. 13. Foodbanks not only provide food, but help to defend against heat stress. MONEY 14. The rich act like their wealth will save them from climate change; but they should fear climate change, just like the rest of us should. A freak storm, made more likely by climate change, sunk billionaire Mike Lynch's 180 foot yacht, drowning him, his daughter and four others. CYCLONES 15. Hurricane Beryl was the earliest Category V hurricane to grace the North Atlantic. Taking advantage of super-heated ocean waters, Beryl intensified from a tropical storm to a Category V hurricane in just 42 hours. Beryl devastated the Windward Islands and Jamaica before crossing the Yucatan Peninsula and making its final landfall on the Texas coast, near Houston, where it caused flash flooding. Beryl was responsible for 40 fatalities with preliminary damage assessments in the billions. Remnants of Beryl, moving inland and north, caused flash-flooding in Vermont. One week after Beryl, thousands in the Houston area remained without power amidst summer heat and humidity. 16. Hurricane Debby was a large slow moving storm that brought intense flooding to Florida and the Atlantic coastal states. Debby was responsible for at least ten fatalities and over one billion dollars in damages. 17. Since Hurricane Beryl, the Atlantic hurricane season, which was predicted by all the models to be above average, has been disappointing, at least to those who like hurricanes. 18. Meanwhile, in the western Pacific Typhoon Shanshan devastates Japan. 19. And South Asia saw a rare August Cyclone which formed over land and moved out to sea. FREEDOM 20. With the removal of dams on the Klamath River, which flows through southern Oregon and northern California, the river runs free and the salmon are free to swim upstream and spawn. 21. Beavers, whose dams provide water which inhibits the growth of forest fires, have been re-introduced to the land of the Tule River Tribe in California. DROUGHT 22.Zambia has experienced a summer of severe drought. HEAT AND FIRE 23. Heat-related deaths in the US have more than doubled since 1999. This is probably a large undercount as heat is often not mentioned as a contributing factor on death certificates. 24.Phoenix, Arizona has experienced a record over 100 straight days with temperatures at or above 100°F. On 56 days this summer, temperatures in Phoenix reached 110°F or higher. 25. June through August is Winter in Australia, yet Australia has been sweltering amidst unprecedented high temperatures, in some places above 40°C. 26. Some watersheds may never recover from devastating wildfires. Wildfires can contaminate drinking water for many years. 27. The great 2024 North American heat wave started in Mexico in mid-March and later moved into Central America and the western United States before moving East. The 2024 North American heat wave was responsible for record temperatures, including 120°F in Las Vegas on July 7. Hundreds have died in this heat wave. 28. On July 15, Rolla Municipal Utilities (RMU) declared a peak alert, exhorting customers to conserve energy during peak hours, 3-6pm. You can learn about RMU's peak alert program here. 29. After a wet winter, vegetation, baked dry in the heat, is burning — again. California has lost $7.7 billion over the last decade due to climate destruction. Oregon's Cow Valley and Durkee Fires have burned hundreds of thousands of acres in Eastern Oregon. California's Park Fire exceeded 400,000 acres. 30. From Spain to China, Eurasia swelters under a massive heatwave. Temperatures topped 40°C across Southern Europe. In Dubai, which flooded earlier in 2024, wet bulb temperatures (a combination of heat and humidity) surpassed 60°C. Over 47,000 people are estimated to have died of heat-related causes in Europe in 2023. 31. Fires in the Brazilian Amazon got off to an early start this year and have reached a 14-year high. 32. Bolivia has declared a national state of emergency due to wildfires that have burned millions of acres of forests and grassland. 33. While we were all watching the Olympics, thousands in Greece were forced to evacuate due to fast-moving fires. WAR 34. In 2023 the world spent almost $2.5 trillion on its militaries. This is not only a missed opportunity to fight climate change, but adds significantly to the world's production of greenhouse gases. This is particularly true in Gaza and Europe where active wars are being fought. It seems like many prefer 100% of nothing to their fair share of what exists. 35. A dam which provided the main source of water to Port Sudan burst killing at least 30. In the midst of a civil war, Sudan has been unable to repair its crumbling infrastructure. PROTESTS 36. Climate activists have been arrested in protests over Citibank's deadly climate-wrecking activities. SCIENCE 37. Richard Heinberg describes in a short article why technology-based solutions to climate change don't work and why nature-based solutions are absolutely necessary. Heinberg notes, Unlike technology, nature constantly repairs itself. It tends to clean up pollution, rather than spreading toxins. Meanwhile, governments spend billions of dollars on technology-based solutions, which benefit the elite who are causing the problem in the first place, while inexpensive nature-based solutions, like biochar, are right before their eyes. CAPITALISM 38. Artificial Intelligence is so energy intensive that Google's carbon emissions have gone up 50% in the last five years. Still, Google toots: “A more sustainable future through information and innovation.” This is an excellent example of what Richard Heinberg talks about in the article discussed above. 39. In a world that ought to be moving away from fossil fuels at breakneck speed, Shell doubles down on natural gas. 40. While we are generating more energy from wind and solar, we are also using more energy, particularly for energy-intensive applications like artificial intelligence and crypto-currency mining. Meanwhile, climate warming emissions continue to increase. ICE 41. The melting of glaciers in the Himalayas has caused over 200 rivulets to dry up, with many more at risk. Lack of water flowing from the Himalayas could severely impact food production in much of Asia. Melting of mountain ice also impacts stability leading to avalanches such as the recent landslide that killed over 50 in Nepal. 42. Melting permafrost is releasing more mercury into the environment than previously thought. Permafrost soil is thought to contain more mercury than all the other soil on the planet, plus all the oceans and the atmosphere. Mercury is an environmental toxin, particularly toxic to young children and pregnant women. OCEANS 43. Hawaii joins California, Oregon and Washington in banning seabed mining in state waters. Indigenous peoples, including Hawaiians, are demanding a seat at the table at the International Seabed Authority. 44. With the end of the 2023-34 El Niño episode, ocean temperatures have fallen slightly from their previous peak, but still remain very high. FLOODS 45. “Hoisted by his own petard:” After cutting $205 million from Florida's stormwater, wastewater, and sewer projects budget, Governor Ron DeSantis declared a state of emergency due to heavy flooding in southern Florida. 46. Speaking of being up to your ass in alligators, monsoon rains in South Asia and hurricanes in North America have led to flooding and crocodile invasions of coastal cities. 47. Nashville, Illinois, a town of 30,000, 50 miles east of St. Louis, was evacuated as heavy rains caused a dam above Nashville to overflow and inundate the town. No injuries have been reported. Over 200 dams in the United States have failed since 2000. 48. Heavy rains paralyze Toronto, Canada's largest city. 49. From Delhi to Mumbai to Kerala, India experiences devastating floods and landslides. 50. The Sahara desert, the world's largest desert, has received rare unexpected rainfall this summer. 51.Yemen, which typically receives little rainfall, was hit by summer rainfall that caused flash-flooding and landslides, killing at least 27. 52. Twentynine Palms in the Mojave Desert, was hit by hail and intense rain causing flash-flooding. LEGAL 53. Six months after the Biden administration's pause in reviewing permits for liquified natural gas export terminals was hailed as a big win for the environment, a federal judge rules feds have no authority to pause review of permits for gas export terminals.  (March through May 2024) 1. Meteorological Spring 2024 was the warmest meteorological Spring on record, measuring 1.49°C warmer than the 1850-1900 average and 0.14°C warmer than the previous warmest meteorological Spring 2016. 2. Each of the last 12 months was the warmest month on record with that same name. The months: Sept. 2023 through April 2024, all broke the 1.5°C above the 1850-1900 average barrier. 3. The last ten 12-month periods ending in May (2015-2024) were the ten warmest on record, with the 12-month period ending May 2024, the warmest 12-month period on record, registering 1.48°C above the 1850-1900 average. Some models claim this 12-month period broke the 1.5°C above the 1850-1900 average barrier. 4. The average concentration of carbon dioxide in the atmosphere during March 2024 was 425.38 ppm, marking an increase of 0.37 ppm in the 12-month running average as measured at the Mauna Loa and Maunakea sites. This is the largest month-to-month increase in the 12-month running average, going back to 1958 when record-keeping at Mauna Loa began. The 12-month running average reached 422.58 in May 2024, an increase of 3.16 ppm over the 12-month running average in May 2023. 5. The El Niño / La Niña (ONI) index over the March through May 3-month period was 0.7, down from the 2.0 average during the November 2023 through January 2024 3-month period , but still within the El Niño range. Climate models are predicting that this El Niño will continue to wane and transition to La Niña conditions during 2024. La Niña conditions favor an intense North Atlantic hurricane season. While strong, the current El Niño episode is well below the strength of the 2014-2016 El Niño. SCIENCE 6. In the wake of Bill McGuire's ground-breaking book, Hothouse Earth, climate scientists are beginning to speak out. In a Guardian poll, 77% (almost 300) of the top climate scientists at the IPCC opine that global temperatures will rise to at least 2.5°C above pre-industrial times, far above limits set by the 2015 Paris Climate Accords. LEGAL 7. 2,000 elderly women, arguing that lack of climate action violates their human rights, win case against the Swiss government in Europe's top human rights court. Does litigation help? You bet it does! OCEANS 8. As oceans continue to warm, the Great Barrier Reef and other coral reefs are suffering what is likely to be their worst-ever case of coral-bleaching. 9. Changes in ocean currents, likely due to our fast-changing climate can cause sudden upwelling of cold water from the ocean depths, which can be deadly to marine life. This scenario is likely to have caused the great South African fish-kill of March 2021. 10. Off the charts heat in the North Atlantic has brought a new category of coral bleaching to the Caribbean and presages a violent hurricane season this Summer and Fall. SUBSIDENCE 11. A study based on satellite images finds that 45% of China's urban areas are sinking. The problem of urban subsidence, along with sea-level rise, is not limited to China and may make many of the world's urban areas unlivable. HEAT 12. Asia has been hit by catastrophic Spring heatwaves. Thousands of schools in the Philippines forced to close due to extreme heat. At least 30 dead in Thailand from heat stroke. Tel Aviv sets an April temperature record. And in Gaza, refugees from Israel's genocidal campaign swelter out in the open. 13. A third year of Spring heatwaves in South Asia has brought record temperatures well above 50°C to India and Pakistan. 14. A vicious heat dome settled over Mexico bringing drought and unprecedented temperatures to our good southern neighbor, killing at least 48. DISEASE 15. While a warming climate spells disaster for humanity, certain diseases revel in it. Puerto Rico declares an emergency as dengue fever spirals out of control. Dengue has caused 1,800 fatalities in the Americas so far in 2024. 16. Valley Fever vastly expands its reach in the US southwest. H5N1 bird flu is spreading, not only among birds, but cattle too. H5N1 has infected humans and may mutate and spread throughout the human population. And the leafhopper bug devastates Argentina's corn crop. FLOODS: Spring has brought catastrophic flooding to many locations. Here are a few links. 17. Dubai received over a year's worth of rain in one day, flooding this normally dry city. 18. Not yet fully recovered from decades of war and foreign invasions, the Afghan drought ended with a bang as heavy rains and flash flooding killed hundreds and devastated villages and farms. 19. Over 100,000 evacuated as heavy rains bring severe flooding to China's Guangdong Province. 20. Levees collapse in Central Russia as flood waters in the Ural River rise. 21. Heavy rains in east and central Africa kill hundreds and bring the water-level in Lake Tanganyika up to record heights. 22. Torrential rains in Brazil's southernmost state of Rio Grande do Sul leave over 100 dead and displace over 1/2 million. 23. Flash floods, mud slides and cold-lava flows kill at least 43 in Indonesia's West Sumatra Province. 24. In the wake of heavy rains, a landslide in New Guinea may have buried thousands of people under tons of mud. DROUGHT 25. Amidst a severe South/Central American drought, Colombians exhorted to conserve water by showering with a partner. 26. Southern Africa is in the midst of a devastating drought. Millions in Zimbabwe will go hungry this year. 27. In parts of Africa, drought resilient camels are replacing cows as the livestock of choice. Camels were introduced in the US desert southwest in the 19th Century, but haven't survived. Perhaps it is time to import camels again. 28. The mild drought we have experienced in Missouri over the past 12 months is, indeed, tiny compared to what other folks have been experiencing. But don't fret. Our time will come. FIRES 29. Canadian wildfires are again off to an early start. They are already causing air pollution in the lower 48 United States. 30. Spring fires in the Arctic which used to be attributed to underground zombie fires left smoldering in the Fall, may be caused by spontaneous combustion as the Arctic heats up in the Spring. 31. Drought induced wildfires in the Amazon could cause total collapse of the Amazon rain forest. CAPITALISM 32. Amidst drought in the Colorado River basin, Wall Street is buying up farmland and selling the water allotment to developments hundreds of miles away at huge profits. 33. While budgeting a paltry seven billion for solar energy, the United States remains among the world's most fossil-fuel friendly nations as the Biden administration licenses what will be the largest oil-export terminal in the United States. And in spite of pledges to stop backing international fossil fuel projects, the U.S. Export-Import Bank will provide a $500 million loan for oil and gas expansion in Bahrain. 34. Big banks have invested trillions in fossil fuel development since the 2015 Paris Climate Accords. JPMorgan Chase tops the list at $431billion, followed by Citigroup and Bank of America. MISCELLANEOUS 35. Thawing permafrost is releasing enough heavy metals into Alaska's rivers that they are turning orange and threatening the health of riparian ecosystems. 36. The world has experienced at least 15 billion-dollar weather disasters so far in 2024, 11 in the United States, including a mid-May derecho that struck Houston with 100+ mph winds, killing at least seven and blowing out windows in tall skyscrapers. A record 500+ tornadoes were sighted in May in the United States 37. Indigenous Sami reindeer herders in Norway are fighting the introduction of high voltage powerlines across their homeland. Rudolph has been complaining for years that powerlines represent an unacceptable hazard to Santa and his reindeer. 38. The use of solar-powered pumps for irrigation in water-poor locations has been so successful that it is causing aquifers to run dry.  (December 2023 through February 2024) 2. The last nine months (June 2023 through Feb. 2024) were each the warmest month on record with that same name by up to 0.42°C. The six months (Sept. 2023 through February 2024) each tied or broke the 1.5°C barrier. 3. The average temperature anomaly from the 1850-1900 period for 2023 was 1.36°C, which set a record, being 0.16°C above the anomaly for previous record-holder, 2016. Some models place the anomaly for 2023 above the famous 1.5°C barrier. 4. The last ten 12-month periods ending in February (2015-2024) were the ten warmest on record. The tenth place 12-month period ending February, 2015, was 0.09°C. warmer than the 11th place period ending in February 2010 5. The average concentration of carbon dioxide in the atmosphere during meteorological winter 2023-24 was 423.04 ppm, an increase of 3.47 ppm over meteorological winter 2022-23, as measured at the Mauna Loa and Maunakea sites. This is the largest increase on record from one meteorological winter to the next. The 12 month running average (Mar. 2023 through Feb. 2024) was 421.70 ppm, up 2.98 ppm from the Mar. 2022 through Feb. 2023 running 12-month average. Meanwhile, global CO2 emissions continue to rise. 6. The El Niño / La Niña (ONI) index over the December 2023 through February 2024 3-month period was 1.8, down from the 2.0 average over the November through January 3-month period. The climate models are predicting that this El Niño will wane and transition to La Niña conditions during 2024. While strong, this El Niño is well below the strength of the 2014-2016 El Niño. La Niña conditions (index of -0.5 or lower) tend to bring cooler global temperatures, while El Niño conditions (index of 0.5 or higher) tend to bring warmer temperatures.7. As late as October, 2023, Climate models failed to predict much of the extreme heat of the latter part of 2023. 8. Not only land temperatures; but ocean temperatures too have increased significantly in 2023. 90% of all heat trapped by greenhouse gases ends up in the ocean. Ocean heat is wreaking havoc on our earthly weather patterns. The 11 months sporting the most anomalous ocean heat are April 2023 through February 2024 (the latest 11 as of this writing). 9. Fishing boats trawling the sea floor are stirring up carbon sequestered at the ocean bottoms, possibly tripling the carbon footprint of the industry. 10. A new study of sea-sponges suggests that we broke the 1.5°C above pre-industrial times barrier years ago and that the Earth had already warmed 0.5°C by the end of the 19th Century, which is a commonly used proxy for pre-industrial times. 11. Advances in battery technology make it economically feasible to replace fossil-fuel fired electricity generating plants with renewable energy generation, combined with battery storage for times when the sun doesn't shine and the wind doesn't blow. In the first half of 2023, 68 gas power plant projects were put on hold or canceled globally, 12. The United States' first small modular nuclear reactor power plant project was cancelled amidst delays, cost overruns and technological advances in battery technology. 13. Rising sea levels and melting glaciers are threatening to uncover and spread nuclear waste buried long ago by the United States in Greenland and the Marshall Islands. 14. Greenhouse gas emissions during the first two months of Israel's War Against Gaza amount to at least 281 thousand tonnes, more than the annual output of many countries. 99% of these emissions can be attributed to Israel, with only a minuscule amount stemming from Hamas and Islamic Jihad rockets. Almost half of these emissions are attributable to US supply flights to Israel. 281 thousand tonnes is probably a gross under-estimate, as it does not include the entire war supply chain. 15. Indeed, we are only beginning to come to terms with the vast amount of climate-wrecking emissions that global militarism wreaks upon us. Pundits have been babbling for some time about how climate change impacts our security and well-being. Little has been said about how war and militarism contribute to climate change. Perhaps 5% or more of greenhouse gas emissions are attributable to militarism. In truth, militarism makes us less secure in oh so many ways. 16. A new study estimates that Climate Change has killed 4 million people so far in the 21st Century, and that's likely a gross underestimate. 17. COP28 was yet another failure. Fossil-fuel interests and their lobbyists again got what they wanted as COP28 failed to provide any significant remedy for the ongoing climate catastrophe. 18. The world experienced 63 climate disasters in 2023, each costing a billion dollars or more. The previous record was 57 billion dollar disasters, set in 2020. The deadliest was Medicane Daniel, a hurricane-like storm in the Mediterranean, which killed over 4,300 in Libya and Greece (mostly in Libya). The most expensive was Typhoon Doksuri which caused 18.2 billion dollars in damages in China and dumped almost 30 inches of rain on Beijing, almost 50% more than Beijing's annual average. 19. The United States also set a record in 2023, experiencing 28 extreme weather disasters in 2023, each costing at least one billion dollar in loses. Leading the pack was the drought and heatwave in the South and Midwest which was responsible for $14.5 billion of the total $92.9 billion in loses and 247 of the total 492 fatalities. The previous record holder, 2020, experienced 22 such disasters. 20. The Smokehouse Creek Fire in the Texas Panhandle, driven by high winds and soaring temperatures, burned over 1 million acres killing two and forced the evacuation of the Pantex plant where nuclear bombs are manufactured. Smokehouse Creek is the largest fire in Texas history and may have been caused by a rotten utility pole that blew over in the wind. It's only February, folks. Wait until July. 21. The North American Great Lakes were virtually ice-free over much of the winter. As of March 7, ice coverage was a mere 2.2%. 22. US President Joe Biden has put permits for new export terminals for liquified natural gas on temporary hold. While hailed as a huge environmental victory, beware! Given Biden's environmental record, this could easily be reversed after the November election. 23. The $1.2 trillion Infrastructure Investment and Jobs Act, which was supposed to expand green infrastructure is being used for highway expansion and may cause an increase in greenhouse gas emissions. 24. California was pounded by two intense atmospheric rivers in early February. 25. El Niño has brought giant waves to the California coast. Wonderful for surfers; but tough on an erosion-prone coastline. 26. The Caribbean Island of Bonaire has sued The Netherlands for failure to protect it from climate change. Bonaire is a “special municipality” of the Netherlands. Special municipality appears to be a polite phrase meaning colony. 27. The Central American drought has disrupted traffic through the Panama Canal. 28. Nearly 11,000 in Ecuador were affected by heavy rains fueled by climate change and a strong El Niño. 29. While deforestation fell by 50% in Brazil's Amazon region in 2023, deforestation increased by 43% in Brazil's Cerrado grasslands to the south and east, wiping out a significant portion of the gain in the Amazon rainforest. 30. Central Chile, which has labored under a severe megadrought for over a decade, was devastated by wildfires that killed over one hundred and caused billions of dollars in damages. 31. The Congo experienced its worst flooding in 60 years, leaving hundreds of thousands homeless. 32. A new study has found that Greenland's ice sheet is retreating at a rate 20% above what was previously thought. Greenland is losing 33 million tons of ice per hour according to this study. 33. Amidst shifts in the Earth's crust, likely contributed to by the melting of glaciers in a warming climate, the town of Grindavik, Iceland is fighting a battle against lava flows from volcanic fissures that have lay dormant for 800 years and now threaten to engulf the town. 34. The UK will exit from the 1994 Energy Charter Treaty that allows fossil fuel corporations to sue governments for “lost profits” while transitioning to clean energy technology. 35. First Eurasia, then North America: were gripped by intense winter cold. 1,000 vehicles were trapped on a major highway in Sweden for 24 hours in an intense winter storm. 36. Russia, a major global supplier of fossil-fuels, complains of Europe's so-called renewable energy transition. 37. Cyclone Jasper struck northern Australia as a category 2 cyclone, causing unprecedented flooding. Jasper was the wettest tropical cyclone on record to hit Australia, dropping over 85 inches of precipitation in places.  (September through November) 2. The last six months (June through Nov. 2023) were all the warmest months on record with that same name by 0.14°C through 0.45°C. 3. The last ten 12-month periods ending in November (2015-2023) were the ten warmest on record. The tenth place 12-month period ending November, 2014, was an insignificant 0.01°C. warmer than the 11th place period ending in November 2010. 4. The average concentration of carbon dioxide in the atmosphere during meteorological autumn 2023 was 419.26 ppm, an increase of 2.89 ppm over meteorological autumn 2022, as measured at the Mauna Loa and Maunakea sites. The 12 month running average (Dec. 2022 through Nov. 2023) was 420.84 ppm, up 0.72 ppm from the Sept. 2022 through Aug. 2023 running 12-month average. 5. The El Niño / La Niña (ONI) index rose to a 1.8 average over meteorological autumn 2023, well within the strong El Niño range. This El Niño episode is yet to reach its height and we are already seeing unprecedented global warmth. La Niña conditions (index of -0.5 or lower) tend to bring cooler global temperatures, while El Niño conditions (index of 0.5 or higher) tend to bring warmer temperatures.6. Antarctic sea ice reached its annual maximum extent of 17 million square kilometers on September 10, setting a record for the lowest recorded maximum extent since record-keeping began. 7. Climate activists are finally getting it. As long as we fight wars among ourselves, climate change will continue to run amok. Bill McKibben points out that climate change in Palestine and Israel far surpasses the global average. 8. Perhaps the one good thing about the Russo-Ukrainian War is that some so-called environmental activists are waking up to war's tremendous devastation of the climate and the environment. Unfortunately, the purpose of this moment of lucidity often seems to be to blame greenhouse emissions from the Russo-Ukrainian War on Russia. The US military remains the largest single user of fossil fuels, responsible for the most greenhouse-gas emissions. 9. The most powerful storm on record in the Black Sea hit Russia and the Ukraine, killing three and devastating infrastructure. Maybe they should think about a truce so both sides can try to recover from the ravages of global warming. 10. At least 177 environmental activists were murdered in 2022. Colombia led the world with 60 murders, followed by Brazil and Mexico. 11. Authorities in The Netherlands attacked over 10 thousand climate activists with water cannons, as they demonstrated against climate-wrecking fossil-fuel subsidies. 12. Teens in South Baltimore, having blocked a proposed waste incinerator from locating in their neighborhood, are now taking on the coal industry, which has been polluting their neighborhood. 13. Grassroots organizing kills plans for wasteful, dangerous carbon dioxide pipeline across five mid-western states. 14. The Missouri Public Service Commission approved the Grain Belt Express transmission line, which, when completed, will bring clean renewable energy to Missouri and other states. Great Rivers Environmental Law Center's attorney, Sarah Rubenstein, argued the case before the Public Service Commission. 15. According to a UNICEF study, in the six years, 2016-2021, 43 million children were made homeless due to extreme weather. 16. Amidst out-of-control global warming, Texans vote billions of dollars for fossil-fuel expansion. Expansion of climate-wrecking fossil-fuels is something the United States, Russia, big banks and other petro-states apparently agree on. 17. After devastating summers fires, Medicane Daniel (a hurricane-like storm in the Mediterranean) flooded Greece, killing over ten. The town of Pelion, Greece received 25 in. of rain in 13 hours. 18. Medicane Daniel went on to devastate Libya, killing tens of thousands as two decrepit dams failed, flooding the city of Derna with a wall of water 20 ft. high . This would likely not have happened, but for the NATO incited 2011 coup, after which Libya, once one of the wealthiest, most stable countries in Africa, descended into civil war becoming a “failed state.” Hillary Clinton famously quipped of Libya's Muammar Gadafi, “We came. We saw. He died.” She might have added along with tens of thousands of others. I know of no better example of the destructive confluence of war and climate change. They are inextricably linked, each one feeding upon the other. 19. South American drought has sent water levels in the Amazon River down to their lowest point in over a century. 20. And to the South, in Brazil's Paran State, heavy rains displaced 70,000 people. 21. After years of drought, heavy rains in Somalia and throughout the Horn of Africa kill 110 and displace 770,000. 22. A glacial lake in northern India overflowed its banks amid heavy rains causing flash flooding that killed at least 70. 23. Hurricane Otis slammed into Acapulco as a Category V storm packing 165 mph winds. Otis killed at least 48, causing estimated damages in excess of $10 billion. Otis is the only hurricane in recorded history to make landfall on the Pacific coast of Mexico as a Category V storm. 24. Hong Kong flooded after recording its heaviest rain since record-keeping began. 25. Wildfires that burned this summer in Canada emitted more CO2 than the entire Canadian economy, perhaps three times as much. Some of the fires continued to burn into the Fall. 26. Like crypto-currencies, artificial intelligence requires huge inputs of power, perhaps equivalent to a country the size of Sweden. Like crypto-currencies, artificial intelligence makes an outsized contribution to global warming. (Doesn't sound very intelligent to me.)  (June through August ) The above estimate is from NOAA. Copernicus Climate Change Service estimates Summer 2023 to have been even more horrendous. 2. The last nine 12-month periods ending in August (2015-2023) were the nine warmest on record. The ninth place 12-month period ending August, 2015, was 0.07°C. warmer than the tenth place period ending in August 2010. 3. The average concentration of carbon dioxide in the atmosphere during meteorological summer 2023 was 421.71ppm, an increase of 2.75 ppm over meteorological summer 2022, as measured at the Mauna Loa and Maunakea sites. The 12 month running average (Sept. 2022 through Aug. 2023) was 420.12 ppm, up 0.69 ppm from the June, 2022 through May, 2023 running 12-month average. This is the first time the 12 month running average has exceeded 420 ppm, which is 50% greater than the 280 ppm concentration, widely believed to represent pre-industrial times. 4. The El Niño / La Niña (ONI) index rose to a 1.1 average over meteorological summer 2023, within the moderate El Niño range. The El Niño episode has barely begun and we are already seeing unprecedented heat waves and fires. La Niña conditions (index of -0.5 or lower) tend to bring cooler global temperatures, while El Niño conditions (index of 0.5 or higher) tend to bring warmer temperatures.5. Meteorological Summer 2023 experienced the longest, most intense, most ubiquitous heatwave ever recorded. Every continent felt the effect of this unprecedented heatwave. There have been so many records broken, so many disasters recorded, that it is hard to know where to begin and where to end. 6. Canadian wildfires have been burning all summer long. Smoke from Canadian fires blanketed the northeast United States. New York City experiences its worst air quality ever. 7. 16 young Montana residents have won a court battle with Judge Kathy Seeley upholding their right to a clean and healthful environment. Plaintiffs sued the State of Montana for violating their constitutional rights to a healthy environment and won!. (Held v. Montana). The suit was filed in March 2020. It took over three years for the suit to come to trial. 8. Funds from wealthy countries to help the third world fight climate change and adapt to global warming are being used to build coal-fired electric plants, airports, chocolate shops, ... you name it. Anything goes. Just another scam like Carbon Capture and Sequestration and net-zero. 9. Top oil and gas companies are making record profits amid disruptions from the Russo-Ukrainian War. Exploration for new oil and gas fields is also up as profits are plowed back into future production. Meanwhile, renewables have been all but forgotten. The G20 nations have plowed at least $1 trillion dollars into oil and gas subsidies. 10. Typhoon Doksuri has brought intense flooding to Beijing. China hopes to supplant the US as the world's chief hegemon. Better do something about global warming first. There is no need for a hegemon on Hothouse Earth. 11. Australia has experienced its warmest Southern Hemisphere Winter on record. Wait until December and see what happens. 12. Phoenix, Arizona has become all but unlivable due to the intense summer heat and drought. 2023 set a record with an overnight low of 97°F. 13. The horn of Africa has been under a severe multi-year drought. The Somalian port city of Hobyo lies buried in sand. 14. Antarctica experienced its lowest Southern Hemisphere Winter sea ice extent on record in 2023. Thousands of penguin chicks died because of the warming climate. 15. Ocean temperatures off the coast of Florida reached hot-tub levels, 101.1°F. 16. Youth protesting against the financing of fossil fuels by international bankers as they met at Jackson Hole, Wyoming were brutalized by police. 17. Heat and drought in Latin America have devastated agriculture and fueled migration to the US and Canada. 18. Heat, Fire and Floods have plagued Europe all summer long, although much of Europe has been too busy fueling the Russo-Ukrainian War to pay much attention to the threat of extreme weather.  (March through May) 2. The last nine 12-month periods ending in May (2015-2023) were the nine warmest on record. The ninth place 12-month period ending May, 2015, was 0.04°C. warmer than the tenth place period ending in May 2010. 3. The average concentration of carbon dioxide in the atmosphere during meteorological spring 2023 was 422.77ppm, an increase of 2.77ppm over meteorological spring 2022, as measured at the Mauna Loa and Maunakea sites. The 12 month running average (June, 2022 through May, 2023) was 419.44 ppm, up 0.7ppm from the March, 2022 through Feb., 2023 running 12-month average. 4. The El Niño / La Niña (ONI) index rose to a neutral 0.1 average over meteorological spring 2023, bringing to an end the three year long La Niña episode. La Niña conditions (index of -0.5 or lower) tend to bring cooler global temperatures, while El Niño conditions (index of 0.5 or higher) tend to bring warmer temperatures.5. A transition to El Niño conditions and temperature anomalies above 1.5°C are expected for later this year. 6. Country Music icon, Dolly Parton, performs her own song on global warming, World on Fire. “Liar, liar, the world's on fire. Whatcha gonna do when it all burns down.” 7. Cyclone Freddy, sets record as the world's longest lived cyclone. Freddy formed off the western coast of Australia in early February, traversed the Indian Ocean, devastated Madagascar, Malawi and other African countries, and finally dissipated in mid-March 8. Floods in the Congo kill over 400. 9. Category 5-equivalent Cyclone Mocha struck Myanmar and Bangladesh killing hundreds and affecting millions. A camp for Rohingya refugees was particularly hard hit. 10. After a multi-year drought that killed tens of thousands in 2022 alone, the Horn of Africa has experienced torrential spring rains. 90% of the inhabitants of Beledweyne in Somalia were forced to evacuate, as the Shabelle River overflowed its banks inundating the town. 11. Heavy Rains in Ecuador affect 80,000 people. 12. Fort Lauderdale, Florida received over 25" of rain in a 24 hour period flooding the city. 13. Heavy rains which started in December in the drought-parched Southwest United States, continued into March causing flooding and landslides, while alleviating drought. 14. Typhoon Mawar, the strongest Northern Hemisphere cyclone ever recorded in May, passed just north of Guam causing power outages and evacuations. 15. Floods in northern Italy kill 13. 16. The carbon footprint of the first year of the War in Ukraine has been estimated at 155 million metric tons. The over $100 billion spent on the war represents a lost opportunity to prevent further warming of our climate. 17. The Intergovernmental Panel on Climate Change (IPCC) produced yet another report issuing dire warnings if we don't cut our greenhouse gas emissions, while never once mentioning war as a driver of climate change. 18. A brutal heat wave, said to be the worst April heatwave in Asian history devastated Eurasia and North Africa from Portugal to Vietnam. 19.Shanghai experienced its hottest May temperature on record, as China appears set for yet another brutally hot summer. 20. Warming temperatures fuel Canadian wildfires from the West to the East. Fires in the Canadian Province of Nova Scotia are said to be the worst fires Nova Scotia has ever experienced. 21. Spring saw an unexpected rise in ocean temperatures. March 2023 was the third warmest March over ocean surfaces, 0.03°C behind first place 2016; but April 2023 was the warmest April by 0.05°C and May 2023, the warmest by 0.08°C. Apparently, no one knows why; but it bodes ill for a warming planet. We'll see what happens in the summer. 22. In spite of paying lip-service to “net-zero,” major US banks continue to finance fossil-fuel expansion and the US government continues to green-light climate-wrecking projects, like the recently approved Willow Project to develop Alaska's north slope oil, the Mountain Valley Pipeline which was part of the “debt ceiling agreement,” and the export of Liquified Natural Gas to Europe in the wake of the War in The Ukraine. 23. Industrial strength solar farms in the California desert destroy fragile desert ecosystems releasing carbon stored underground into atmosphere. 24. Chad was the nation with the worst air quality in 2022; Lahore, Pakistan was the city with the worst air quality in 2022, according to IQAir report. 25. A World Meteorological Organization study found that over 90% of deaths from extreme weather have occurred in the third world (global south). 26. Over 190 nations agree to UN High Seas Treaty to protect marine ecosystems and marine life.  (December 2022 through February 2023) 2. The last nine 12-month periods ending in February (2015-2023) were the nine warmest on record. The ninth place 12-month period ending February, 2015, was 0.09°C. warmer than the tenth place period ending in February 2006. 3. The average concentration of carbon dioxide in the atmosphere during meteorological winter 2022-23 was 419.61 ppm, an increase of 1.55 ppm over meteorological winter 2021-22, as measured at the Mauna Loa and Maunakea sites. The 12 month running average (March, 2022 through February, 2023) was 418.75 ppm. 4. The El Niño / La Niña (ONI) index rose to -0.7 over meteorological winter 2023, from -1.0 during meteorological fall. still within the weak La Niña range. This makes three winters in a row in which La Niña conditions prevailed. Monthly temperature anomalies have been mostly within the top ten in spite of the extended La Niña which could be expected to bring cooler temperatures. La Niña conditions are predicted to end this Spring, transitioning to neutral and possibly to El Niño by the summer.. La Niña conditions (index of -0.5 or lower) tend to bring cooler global temperatures, while El Niño conditions (index of 0.5 or higher) tend to bring warmer temperatures.5. February wildfires, amid heat and drought, devastated Chile, burning over one million acres. Chile has experienced a megadrought for over a decade. 6. T rkiye (formerly Turkey) and Syria were hit by an earthquake and series of aftershocks that killed over 55,000 people. What part global warming and the melting of glaciers in nearby mountains might have played in this tragedy are unknown. 7. February 2023 saw a record low for sea ice in the antarctic. 8. On New Year's Day heat records fell all over Europe. This may be the most extreme heat wave in European history. 9. A study from the Potsdam Institute for Climate Impact Research found that climate change has made many in poor countries too poor to even migrate. 10. Global Warming may have contributed to 8,000 shootings in 100 US cities according to a recent study. 11. Upstate New York experienced deadly blizzards this winter, including a late December blizzard which dumped up to 52 inches of snow on Buffalo New York, killing at least 37. 12. New Zealand's largest city, Auckland, experienced its wettest month in 170 years of record keeping. On Jan. 28, Auckland s Albert Park reported over eight inches of rain during a six hour period. January floods were fueled by a marine heat wave, warming ocean temperatures up to 6°C. 13. On February 3, Mt. Washington, New Hampshire recorded a wind chill of -108.4, the coldest ever recorded in the United States. 14. Over 1,000 methane super-emitting events were recorded in 2020, mostly from oil and gas extraction sites. The worst event was a leak of 427 metric tons of methane an hour in August, near Turkmenistan s Caspian coast. A site in Iraq near Basra emitted 356 metric tons per hour. Methane is 86 times more potent a greenhouse gas than carbon dioxide over a period of 20 years. Failure to plug these leaks could keep the goal of limiting global warming to 1.5°C out of reach. 2. The last eight 12-month periods ending in December (2015-2022) were the eight warmest on record. The eighth place 12-month period ending December, 2018 was 0.08°C. warmer than the ninth place period ending December 2014. 3. The average concentration of carbon dioxide in the atmosphere in December, 2022 was 418.95 ppm, an increase of 2.24 ppm over December, 2021, as measured at the Mauna Loa and Maunakea sites. The 12 month running average (January, 2022 through December, 2022) was 418.56 ppm. 4. The El Niño / La Niña (ONI) index rose to -0.9 for the three month period, October through December, 2022, within the weak La Niña range. This makes three winters in a row in which La Niña conditions prevail. Monthly anomalies have been mostly within the top ten in spite of the extended La Niña which could be expected to bring cooler temperatures. La Niña conditions are predicted to end in the Spring. La Niña conditions (index of -0.5 or lower) tend to bring cooler global temperatures, while El Niño conditions (index of 0.5 or higher) tend to bring warmer temperatures.5. The United States suffered 18 different billion-dollar weather-related disasters in 2022. Hurricane Ida led the pack piling up over $100 billion in damages, followed by the western drought which weighs in at $22 billion in damages. Many other countries also suffered tremendous weather-related loses in 2022, most notably, Pakistan. At the height of the flood, 1/3 of Pakistan lay under water. 6. Alaska saw over three million acres go up in smoke in 2022; Meanwhile, California lost only 364,000 acres to fire in 2022, less than 10% of the four million acres lost in 2020. 7. California has been bone dry for years; but in late December, the rains came with a vengeance, and continued into January causing devastating floods in much of the State. 8. Global Warming may have contributed to 8,000 shootings in 100 US cities according to a recent study. 9. A late December blizzard dumped up to 52 inches of snow on Buffalo New York, killing at least 37. 10. My apologies for neglecting to mention the tremendous July flooding in St. Louis in previous posts. 11. While climate-related disasters struck all over the world in 2022, Nature appears to have been particularly unkind to the United States; but then we continue to pollute her atmosphere with climate-warming greenhouse gases. Nature bats last. 2. The last eight 12-month periods ending in November (2015-2022) were the eight warmest on record. The eighth place 12-month period ending November, 2018 was 0.07°C. warmer than the ninth place period ending November 2010. 3. The average concentration of carbon dioxide in the atmosphere in November, 2022 was 417.51 ppm, an increase of 2.50 ppm over November, 2021, as measured at the Mauna Loa site. The 12 month running average (December, 2021 through November, 2022) was 418.37 ppm. 4. The El Niño / La Niña (ONI) index held steady at -1.0 for the three month period, September through November, 2022, still within the moderate La Niña range. This makes three winters in a row in which La Niña conditions prevail. Monthly anomalies have been mostly within the top ten in spite of the extended La Niña which could be expected to bring cooler temperatures. La Niña conditions (index of -0.5 or lower) tend to bring cooler global temperatures, while El Niño conditions (index of 0.5 or higher) tend to bring warmer temperatures.5. COP27, like COPs 1 through 26, ended without a global plan for phasing out oil and gas emissions. COP27 approved in theory reimbursing countries that have contributed least to and suffered most from global warming. However, no agreement was reached as to how this would happen. 6. Scientists at Lawrence Livermore briefly achieved fusion ignition, in which they got more energy out of the fusion of hydrogen nuclei than they put into it. But don't get your hopes up. We are still decades or more from commercial fusion energy. 7. Sabotage of the Nord Stream pipelines probably resulted in the single largest release of methane into the atmosphere in recent history. Over a 20 year period, methane is 86 times more powerful a greenhouse gas than carbon dioxide. Reducing emissions definitely plays second fiddle to fighting wars. 8. Bill McGuire's recently released book, Hothouse Earth, an Inhabitant's Guide, probably marks the first time a respected Earth scientist noted publicly that climate collapse is upon us now and we would do well to adapt to it rather than trying to wish it away. 9. Hurricane Ian cut a path of destruction across central Florida killing 150 and doing over $50 billion of damages. Interestingly, Babcock Ranch, a solar powered town 12 miles from Fort Myers built for climate resiliency sustained only minimal damage. 10. Glacial melt and monsoon rains, following on the heels of brutal Spring heat, caused summer flooding which left 1/3 of Pakistan under water killing over 1,700 and causing $15 billion of damage. 2. The last eight 12-month periods ending in June (2015-2022) were the eight warmest on record. Eighth place June 2015 was 0.07°C. warmer than the ninth place June 2010. 3. The average concentration of carbon dioxide in the atmosphere in June, 2022 was 420.99 ppm, an increase of 2.05 ppm over June, 2021, as measured at the Mauna Loa site. The 12 month running average (July, 2021 through June, 2022) was 417.39 ppm. 4. The El Niño / La Niña (ONI) index rose to -1.0 for the three month period, April through June, 2022, still within the moderate La Niña range. This may be a sign that the current moderate La Niña episode could continue through the summer and possibly into a third year. Global temperatures have remained high in spite of the ongoing La Niña episode. La Niña episodes typically bring cooler global temperatures. La Niña conditions (index of -0.5 or lower) tend to bring cooler global temperatures, while El Niño conditions (index of 0.5 or higher) tend to bring warmer temperatures.5. From Germany to China to Australia, as planet Earth continues to heat, and war disrupts energy supplies, nations turn to coal for energy, thereby further over-heating planet Earth. 6. The Supreme Court of the United States has gutted the EPA and the US government's ability to protect life on Earth from climate change. 7. Yellowstone National Park is closed for the foreseeable future. Heavy rain and warm temperatures on top of a deep, melting Spring snowpack led to devastating floods. 8. On the night of June 10, Phoenix experienced a LOW temperature of 90°F. It's only June. Who knows what July and August will bring? Cities, like Phoenix, are fast becoming unlivable due to extreme heat. 9. Iconic rivers and lakes in the US Southwest are all but disappearing due to long-term drought and heat. The Rio Grande, the Colorado River, Great Salt Lake, Lake Mead and Lake Powell are all shrinking and may soon disappear entirely. 10. Thousands of cows in Kansas died from extreme heat. Meanwhile, in Ethiopia, 1.5 million cows have died due to a prolonged multi-year drought. Perhaps, this is a sign we should switch to a more vegetarian diet. Cows are heavy producers of the powerful greenhouse gas, methane. 11. The remnants of early season Hurricane Agatha which struck Oaxaca on May 30, killing 11, reconstituted themselves in the Caribbean (after a sex change) as tropical storm Alex, killing four in Cuba and flooding parts of southern Florida. 12. Afghanistan, still suffering from hunger and the ravages of a recent earthquake, is struck by flash flooding which killed 19. 13. Bangladesh and Eastern India continue to experience devastating floods. Much of Bangladesh, a low-lying country, may soon be under water. 14. Spain has been devastated by wildfires, heat and drought. The heatwave extends over much of Europe. 15. The Amazon has suffered its worst six months of deforestation in the first half of 2022, 80% greater than the first half of 2018. June was a particularly bad month for the Amazon. |
